- Last updated
The Water Using Process and Wastewater Recycling Effectiveness of Thermal Power Plants
All TPC thermal power plants have general wastewater treatment systems. We will also ensure by monitoring that wastewater discharge is compliant with the Effluent Standards. Otherwise, we do our best to recycle wastewater in order to enhance water usage efficiency.
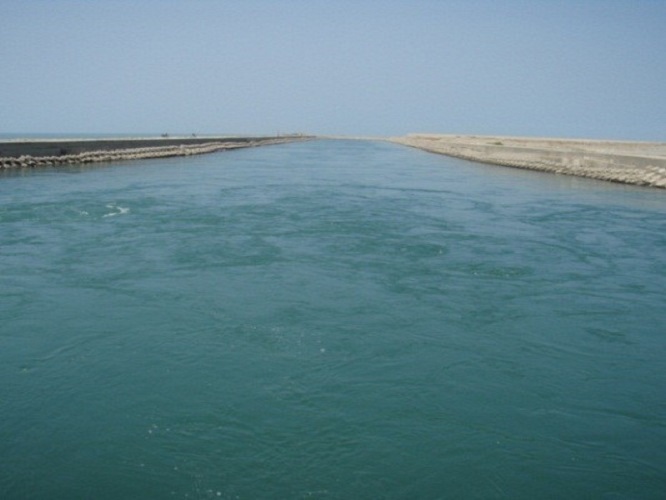
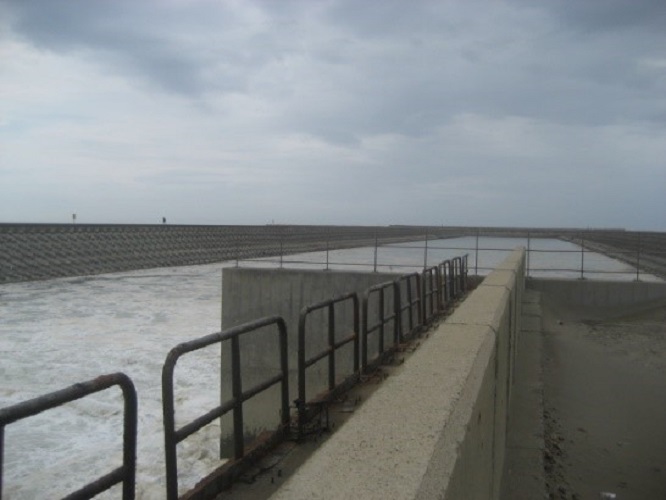
Before setting up the discharge facilities, the best discharge method is determined by numerical simulation and hydraulic model tests, in order to reduce the impact of thermal effluent on marine ecology.

| Power Plant |
Water Source | Effluent of Treated Wastewater (tons) | Reuse of wastewater (tons) |
Recovery (%) |
Remark |
|---|---|---|---|---|---|
| Hsiehho | tap water | 56,228 | 32,722 | 58.21% | 1. Season 2: Due to the frequent shutdown of units in this season, the amount of recycled water used is relatively small, and the recycled water pool is full and is discharged. Therefore, the discharge volume in recent months is large and the recovery rate is low. 2.Season 3 and 4: Due to the recent algae growth in the recycling pool of this factory, in order to solve the fundamental source of algae growth in the recycling pool, it is planned to temporarily release the treated water to reduce the existing treated water in the recycling pool, so the recovery rate has dropped significantly (this work has been completed on 11/14/2013). |
| Linkou | tap water well water |
442,192 | 325,531 | 73.62% | |
| Tatan | tap water | 231,992 | 168,948 | 72.85% | |
| Tunghsiao | tap water | 340,237 | 183,285 | 53.87% | 1.Season 1: Due to the regular inspection of the boiler and pressure vessel of unit #4, it was necessary to empty it, and the condenser of unit #5 (HRSG51) leaked seawater. In addition, the water washing wastewater of small units, plus the backwash of the resin maintenance of the water plant's positive tower, all the above wastewater was discharged to the wastewater treatment plant, resulting in an increase in emissions and a decrease in recovery rate. 2.Season 2: The weld of the high-pressure superheater gas header of the boiler of Unit 1 (HRSG12) broke and leaked, and the boiler and pipeline flushing (FLUSH) of Unit 2 after overhaul caused the emission to increase and the recovery rate to decrease. 3.Season 3: The continuous flushing valve of the high-pressure steam drum of unit #5 (HRSG52) leaked, the high-pressure steam drain valve could not be closed tightly, resulting in steam leakage, and the drain valve of the air-conditioning system on the roof of the ST2 steam turbine building could not be closed tightly during cleaning, resulting in increased emissions and decreased recovery rates. 4.Season 4: The high-pressure outlet water discharge electric valve and indirect flushing valve of unit #5 (HRSG52 and 53) leaked, and other air-conditioning cooling towers leaked, resulting in increased emissions and decreased recovery rates. |
| Taichung | tap water | 791,695 | 791,695 | 100.00% | |
| Hsinta | tap water | 457,069 | 214,467 | 46.92% | Season 2, 3, and 4: Because the recycled water tanks had been filled to a high liquid level and there was rainfall this season, the utilization rate of recycled water for irrigation and road dust suppression was low, and the recycled water was not as fast as the recovery rate, resulting in the inability to recycle wastewater and a lower recycled water rate than the previous month. |
| Talin | tap water | 467,634 | 344,782 | 73.73% | |
| Nanpu | tap water | 76,004 | 29,026 | 38.19% | Season 2, 3, and 4: The runoff wastewater generated by rainfall in this season flows into the wastewater field for direct discharge, and the water discharge of the units has decreased recently (direct discharge without recovery), so the recovery rate has decreased. |
| Chienshan | tap water | 6,851 | 6,851 | 100.00% | |
| Tashan | tap water | 8,648 | 3,498 | 40.45% | In the third quarter, the flowmeter calibration at the beginning of the month, the recycled water pipeline was not switched. Therefore some domestic sewage was released. |
| total | 2,878,480 | 2,100,816 | 72.98% |
Note: The industrial wastewater had excessive salt concentration from the flue gas desulfurization process (FGD). This wastewater was unusable because it could cause serious corrosion and salination of the soil, therefore, it was not counted in the total wastewater.
Monitoring the Quality of Effluent from Thermal Power Plants
The annual average value of effluent water monitoring of each thermal power plant in 2024, including the content of hydrogen ion concentration index(PH), suspended solids(SS), and chemical oxygen demand(COD), etc. The monitoring results all meet the Effluent Standards, as shown in the table below.
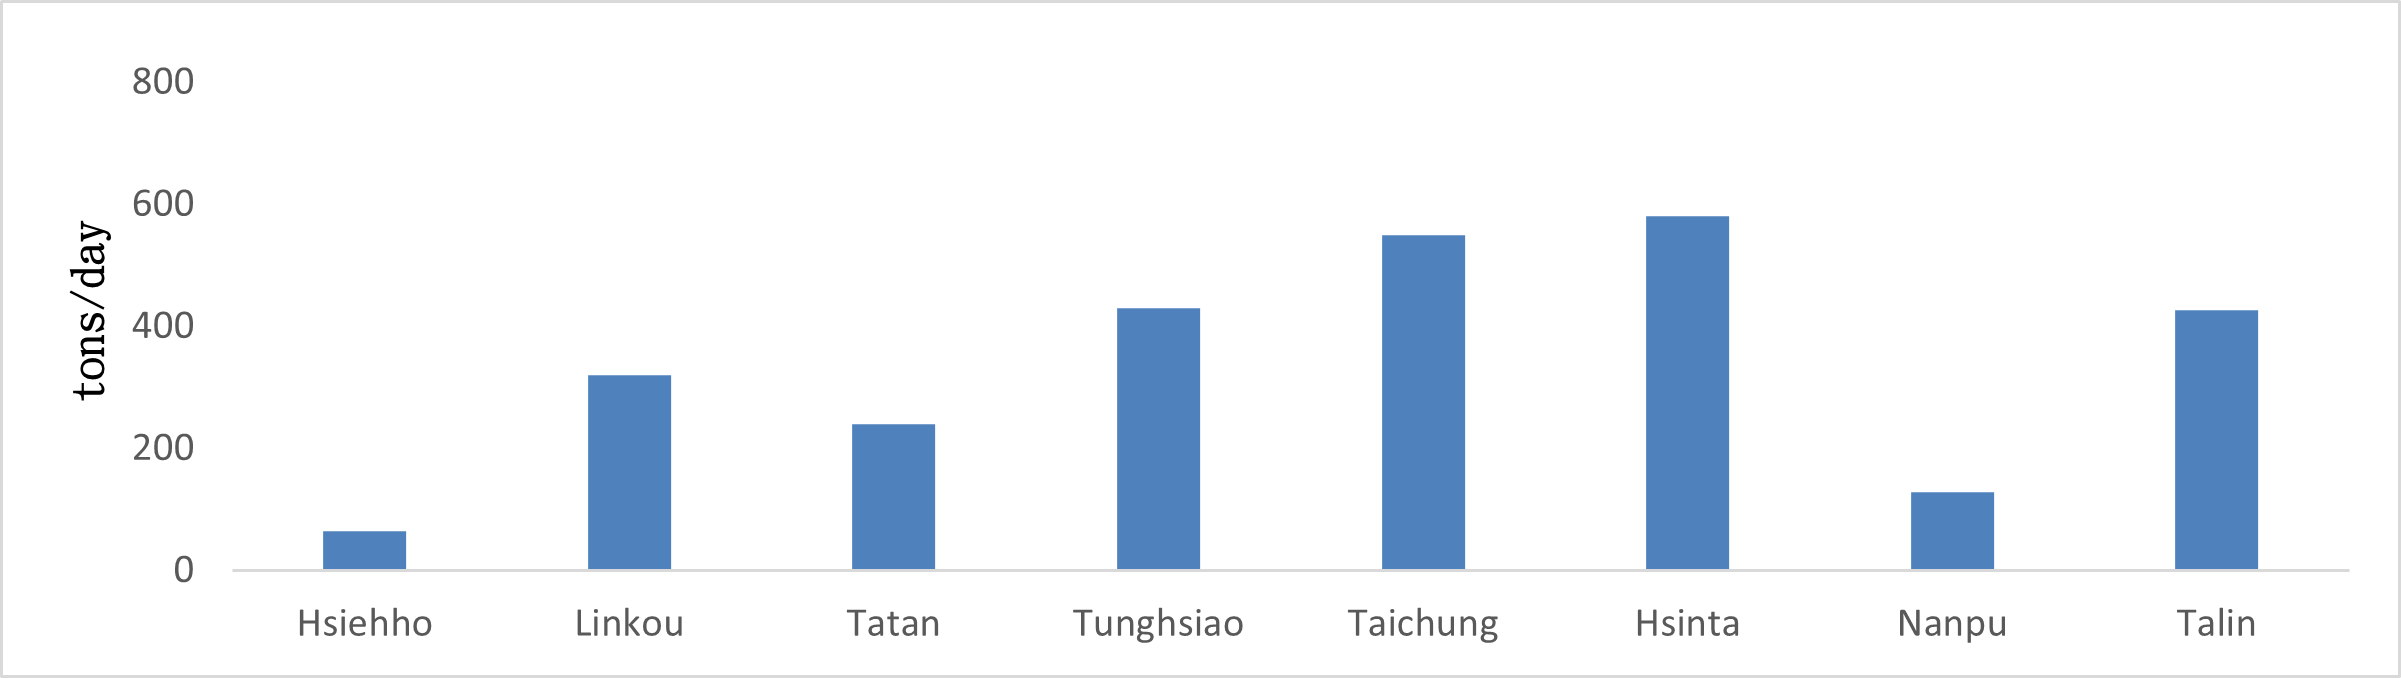
| Power Plant |
Water Discharge (tons/day) |
pH | Suspended Solids (SS) (mg/L) |
Chemical Oxygen Demand (COD) (mg/L) |
Biochemical Oxygen Demand (BOD) (mg/L) |
|---|---|---|---|---|---|
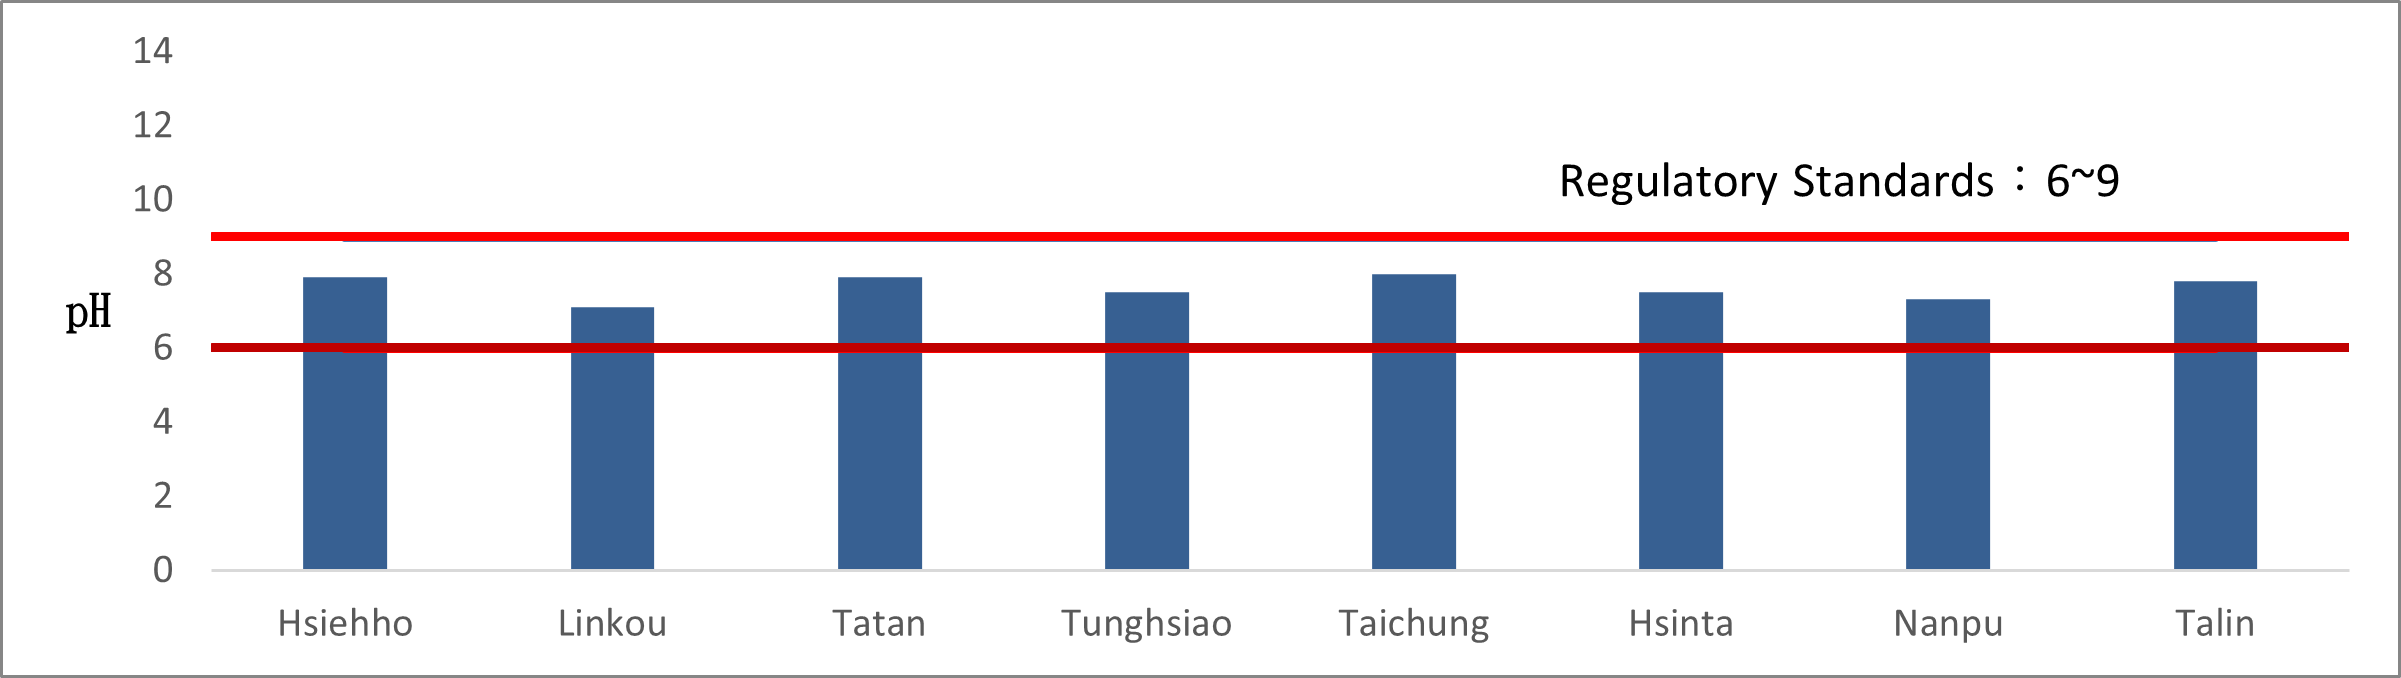
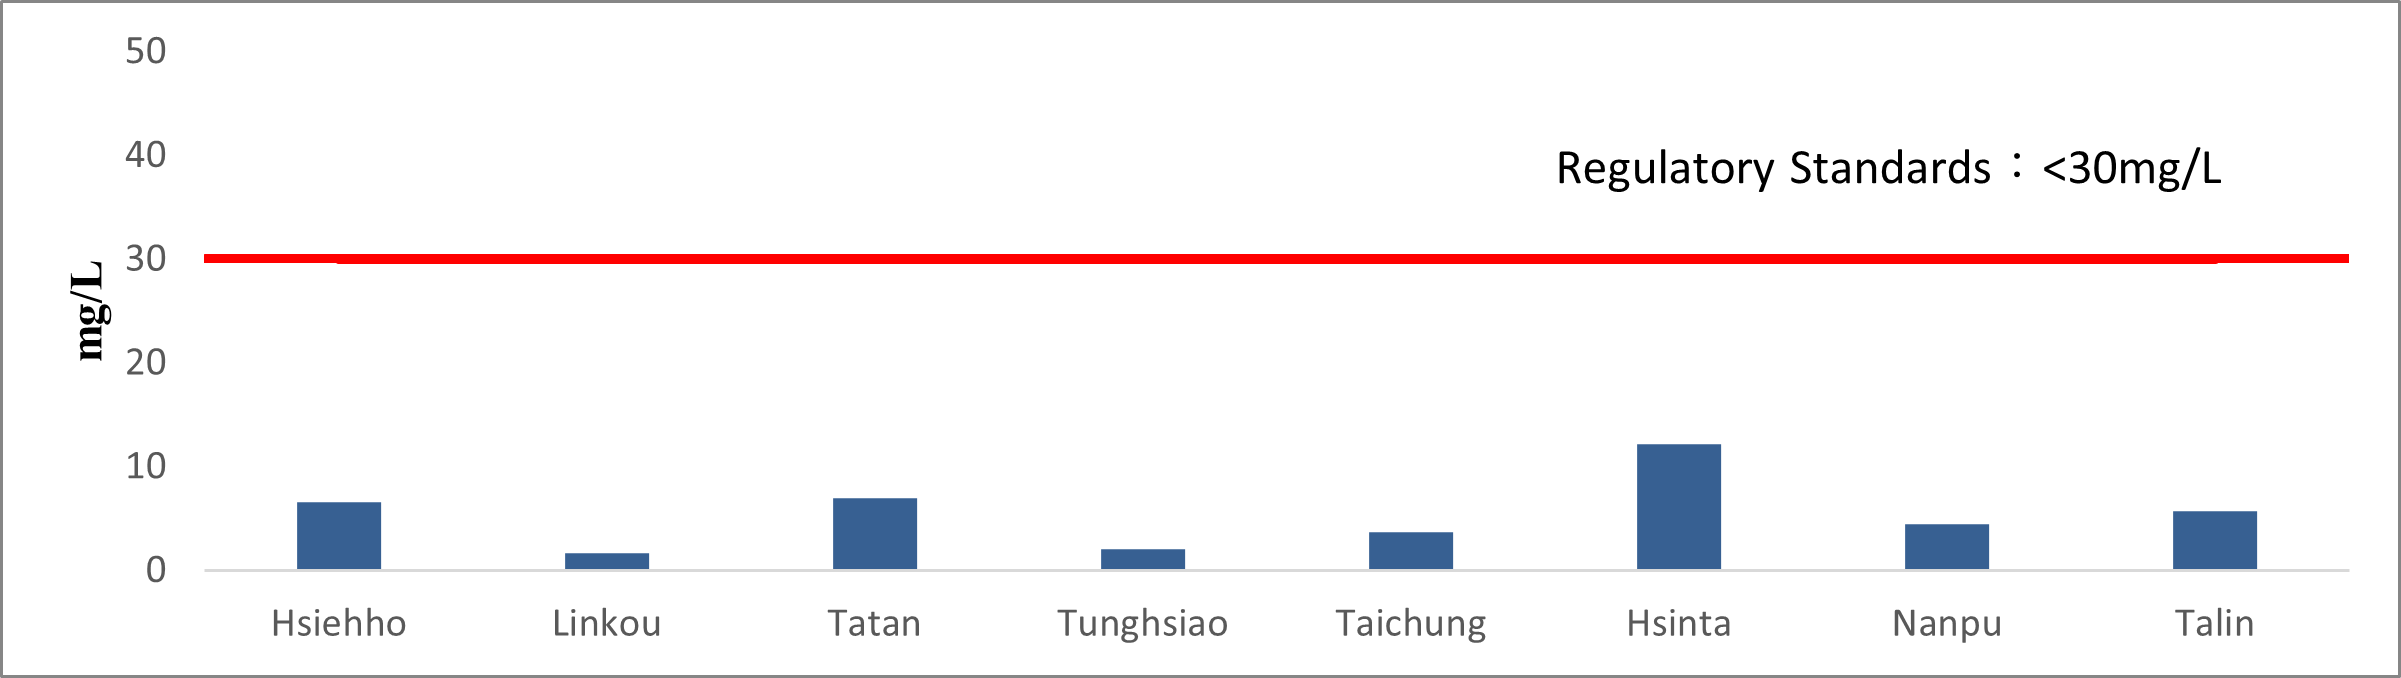
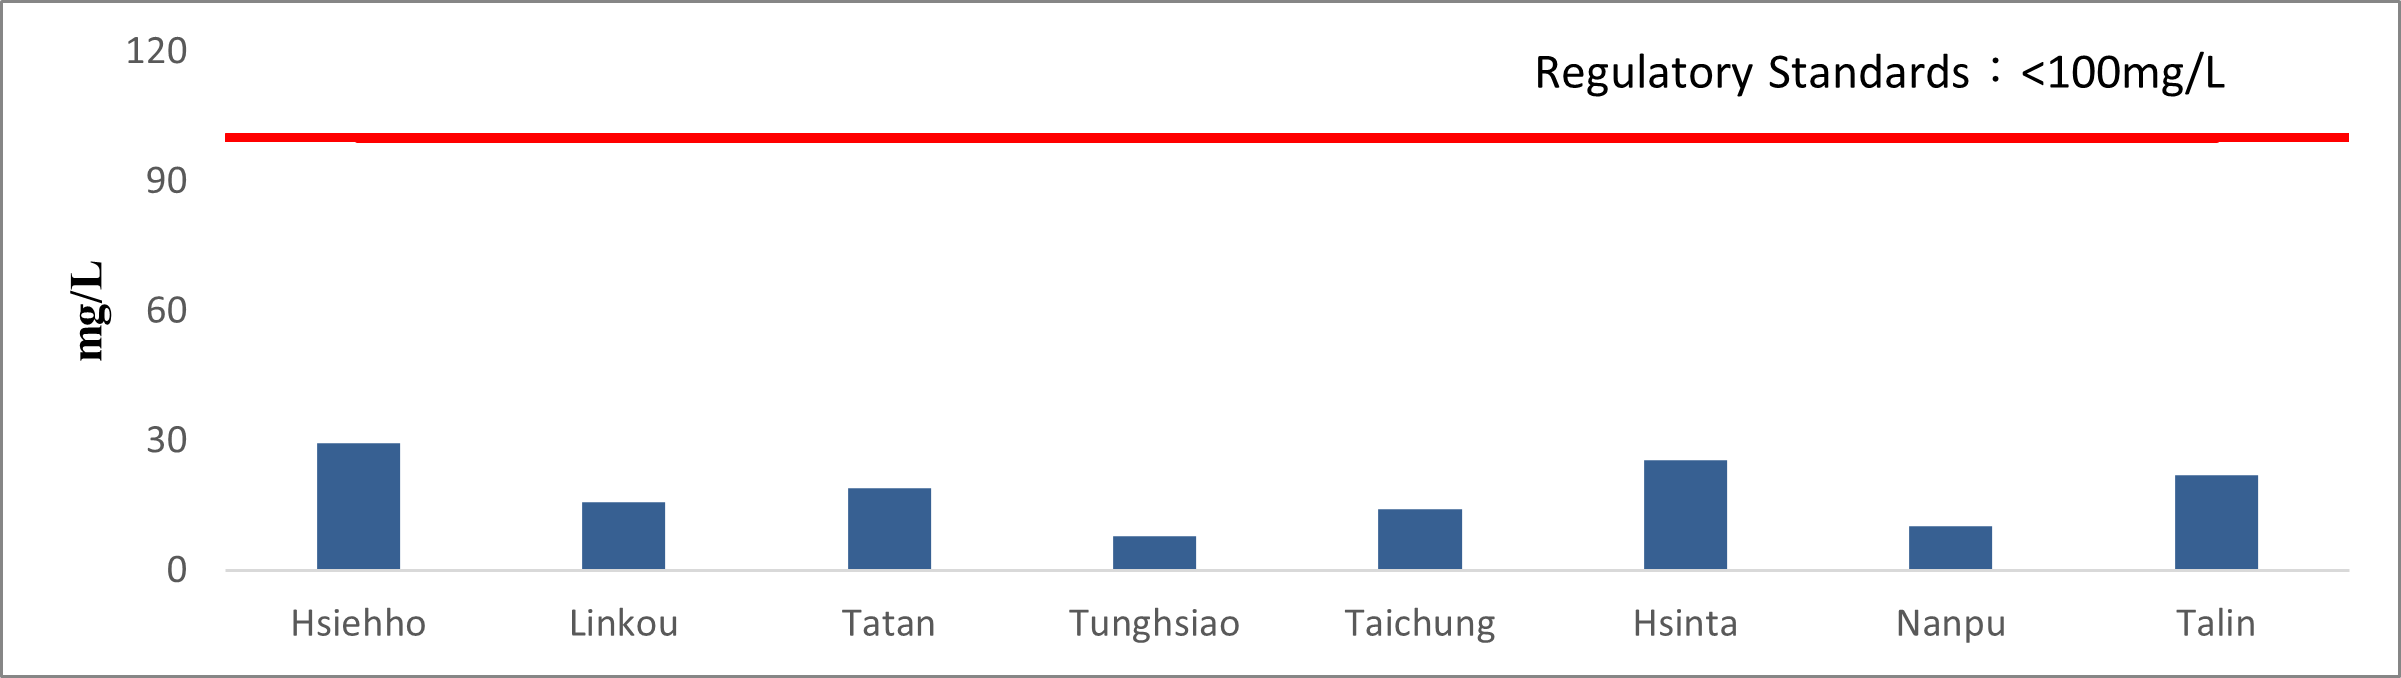
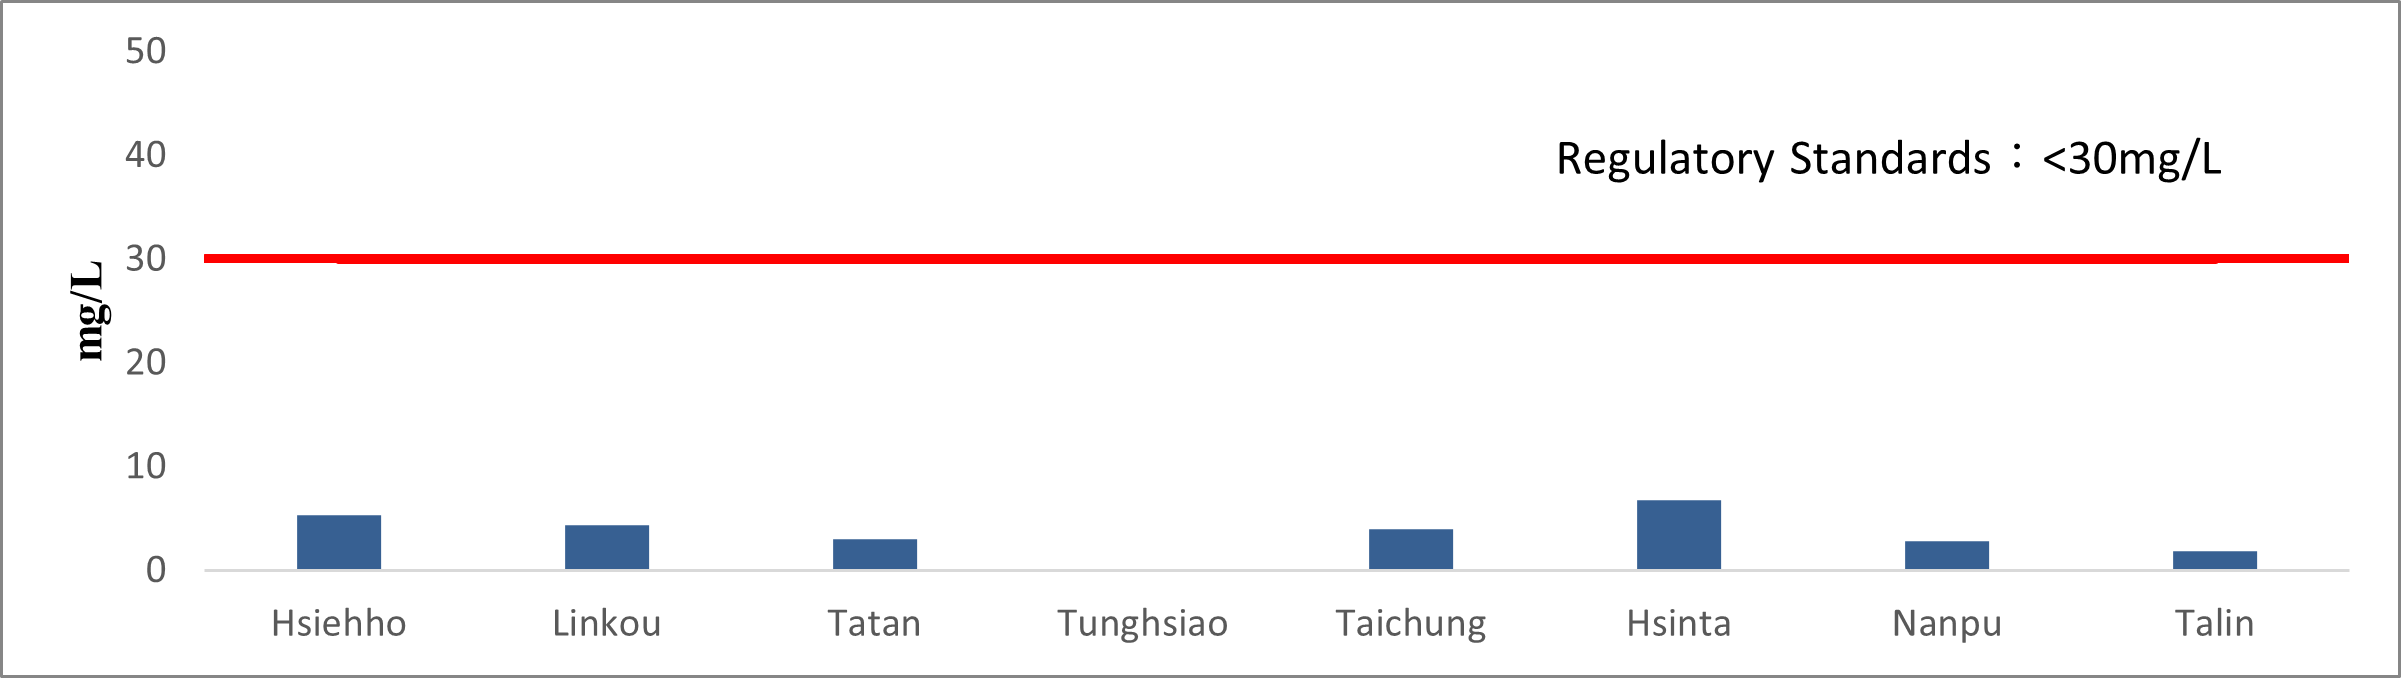
| Hsiehho | 64 | 7.9 | 6.6 | 29.5 | 5.3 |
| Linkou | 319.6 | 7.1 | 1.7 | 15.8 | 4.4 |
| Tatan | 240 | 7.9 | 7 | 19 | 3 |
| Tunghsiao | 430 | 7.5 | 2 | 7.9 | <1.0 |
| Taichung | 550 | 8 | 3.7 | 14.2 | 4 |
| Hsinta | 580 | 7.5 | 12.2 | 25.4 | 6.8 |
| Nanpu | 128.7 | 7.33 | 4.45 | 10.25 | 2.85 |
| Talin | 427 | 7.8 | 5.7 | 22 | 1.9 |
| Standards | - | 6 ~ 9 | 30 | 100 | 30 |
Note: pH is the hydrogen ion concentration index.
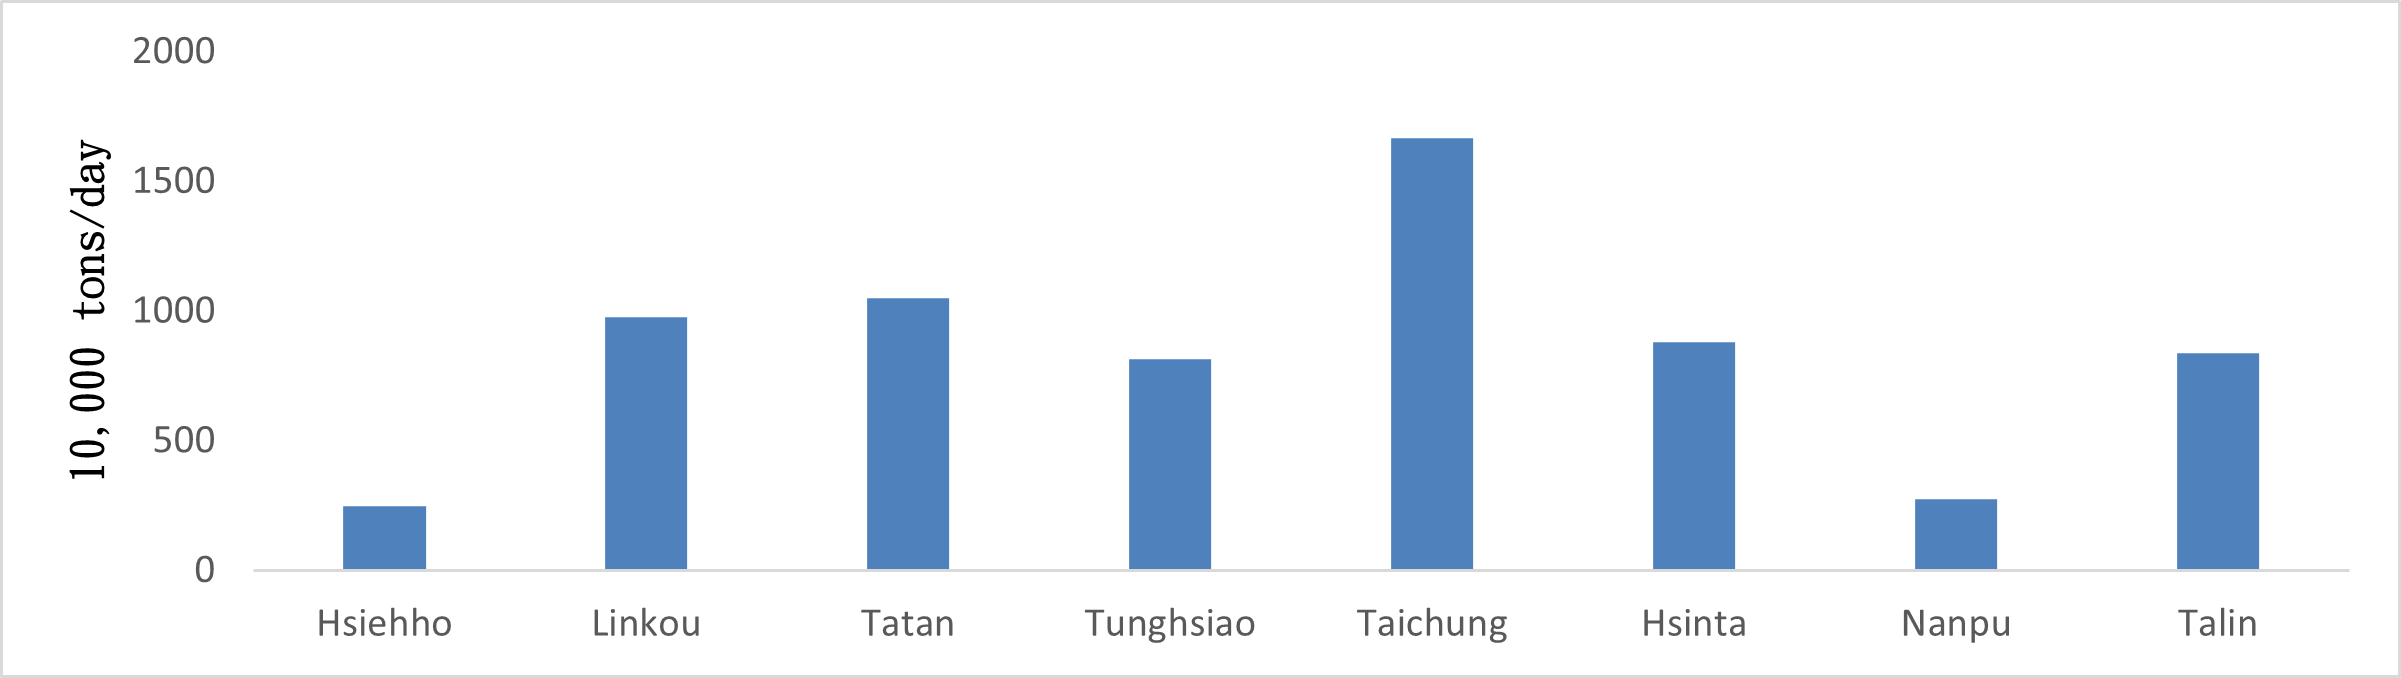
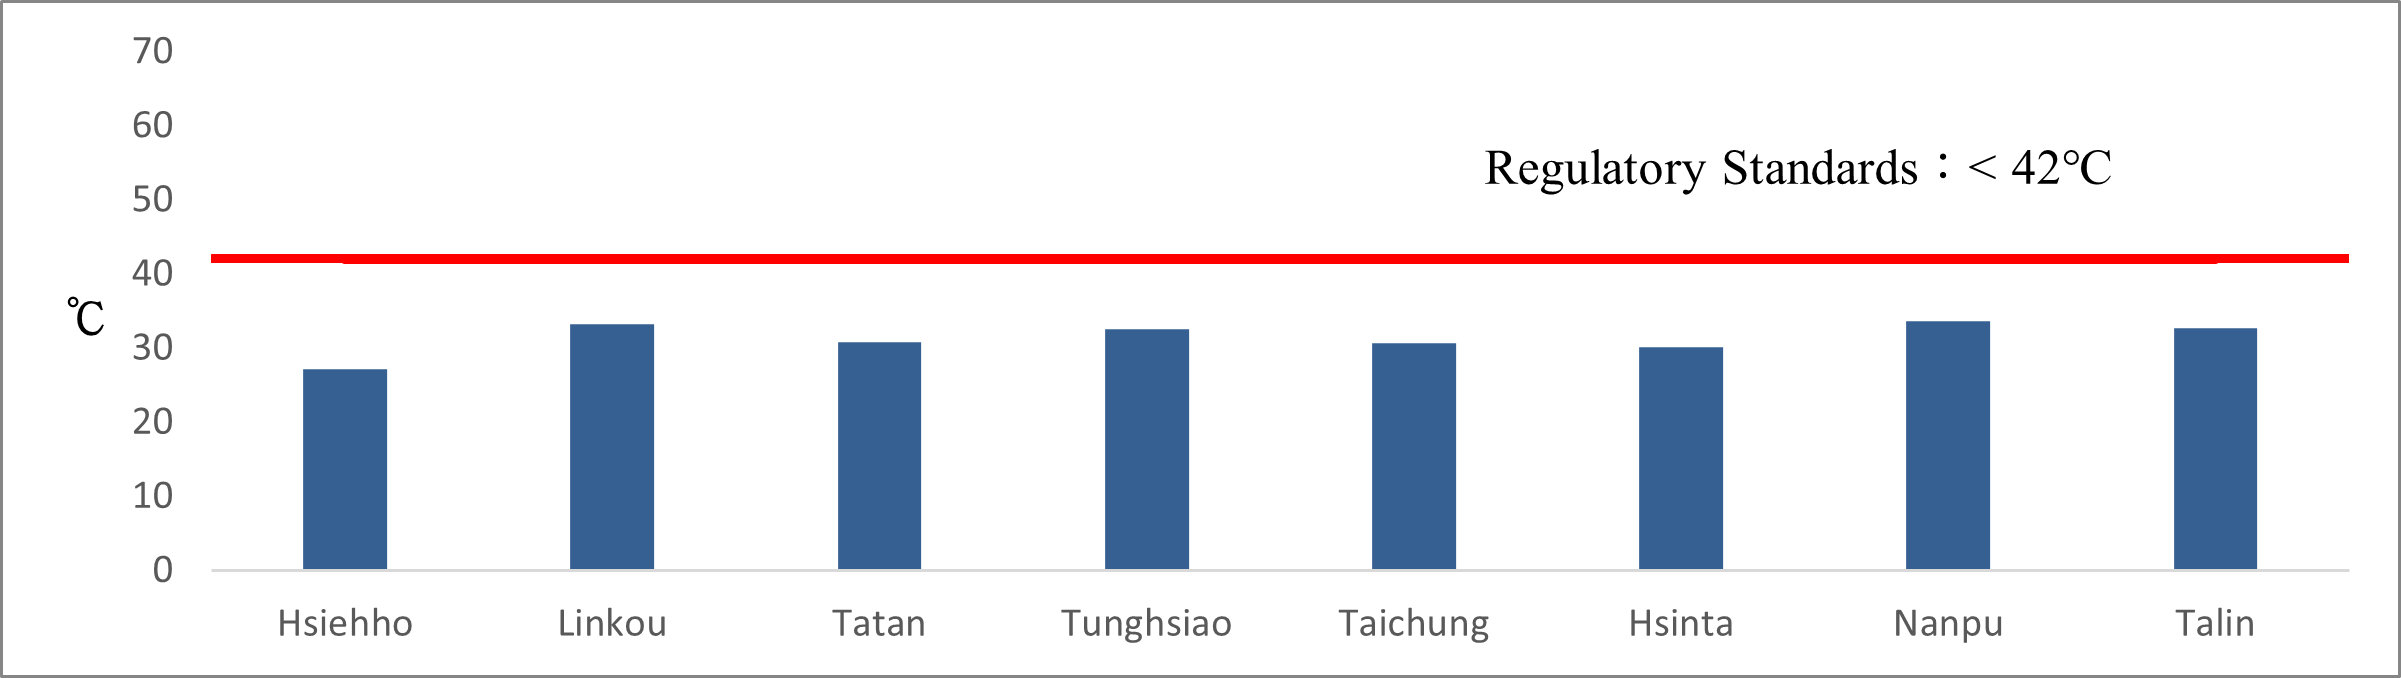
| Power Plant |
Water Discharge (10,000 tons / day) |
Water Temperature at the Discharge Point (°C) |
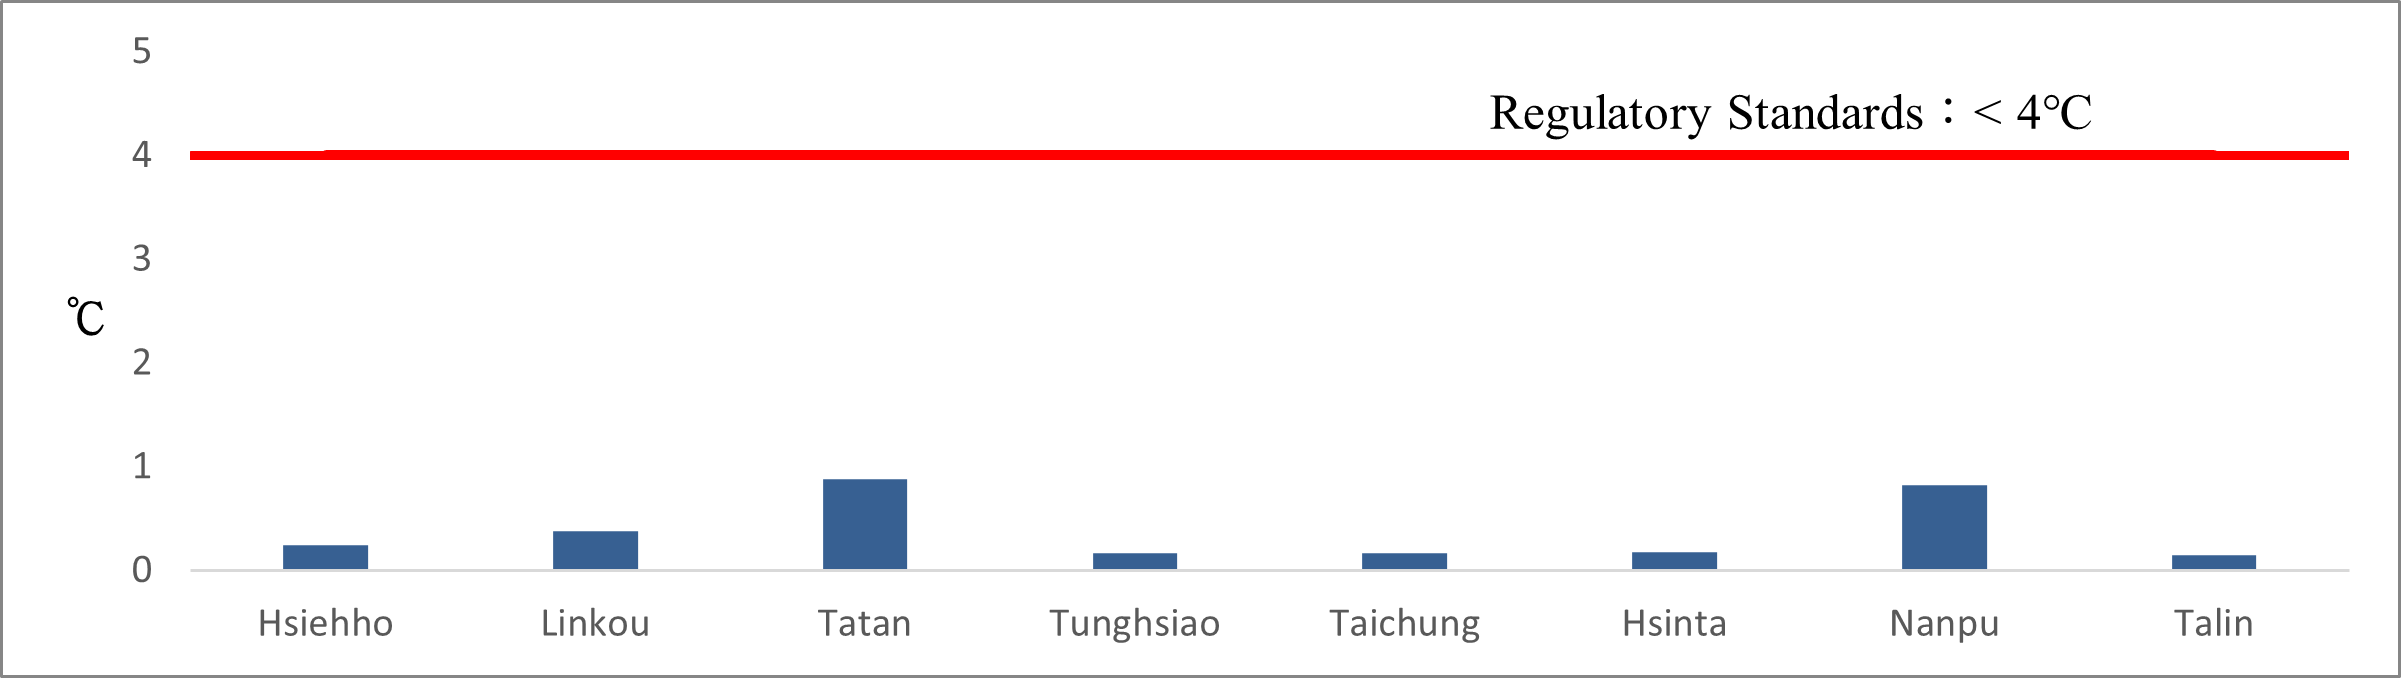
the Temperature Difference of Surface Water 500m far from the Discharge Point (°C) |
|---|---|---|---|
| Hsiehho | 247 | 27.1 | 0.24 |
| Linkou | 975 | 33.2 | 0.38 |
| Tatan | 1,049.3 | 30.79 | 0.88 |
| Tunghsiao | 814 | 32.5 | 0.17 |
| Taichung | 1,668 | 30.7 | 0.17 |
| Hsinta | 879 | 30.14 | 0.18 |
| Nanpu | 273.71 | 33.63 | 0.82 |
| Talin | 838 | 32.73 | 0.15 |
| Standards | - | <42 | <4 |
Note: pH is the hydrogen ion concentration index.
.jpg)
.jpg)
Water Discharge of Thermal Power Plants in 2024
Water Discharge of Thermal Power Plants (PDF)
pH of Thermal Power Plants in 2024
pH of Thermal Power Plants (PDF)
SS of Thermal Power Plants in 2024
SS of Thermal Power Plants (PDF)
COD of Thermal Power Plants in 2024
COD of Thermal Power Plants (PDF)
BOD of Thermal Power Plants in 2024
Thermal Effluent Discharge of Thermal Power Plants in 2024
Thermal Effluent Discharge of Thermal Power Plants (PDF)
Thermal Effluent Temperature at the Discharge Point of Thermal Power Plants in 2024
Thermal Effluent Discharge of Thermal Power Plants (PDF)
The Temperature Difference OF Surface Water 500m far from the Thermal Effluent Discharge Point of Thermal Power Plants in 2024