- Last updated
Renewable Energy
As of the end of December 2023, the contracts for renewable energy power generation systems for electricity sales totaled 55,385, with a total installed capacity of 13,921 MW.:
| Source | Contract | Purchasing Capacity (MW) |
|---|---|---|
| Solar | 55,155 | 11,385 |
| Wind | 146 | 2,222 |
| Hydro and others | 84 | 314 |
| Total | 55,385 | 13,921 |
| Year | Power Purchased (TWh) |
Fee (billion NT$) |
Average Purchase Rate (NT$/ Per kWh) |
|---|---|---|---|
| 2019 | 5.79 | 24.88 | 4.26 |
| 2020 | 7.67 | 35.33 | 4.65 |
| 2021 | 9.17 | 42.60 | 4.69 |
| 2022 | 12.70 | 58.88 | 4.75 |
| 2023 | 17.39 | 90.50 | 5.20 |
Independent Power Plant (IPP)
Number of agreements: There are 9 IPPs operated at present, with 8280.5 MW purchase capacity in total. There are 2 coal power plants (3,108.6MW) and 7 LNG power plants (5171.9MW)
Term of purchase agreement: 25 years from the operating date.
| Year | Power Purchased (TWh) |
Fee (billion NT$) |
Average Purchase Rate (NT$/ Per kWh) |
|---|---|---|---|
| 2019 | 39.36 | 112.45 | 2.88 |
| 2020 | 40.59 | 103.51 | 2.57 |
| 2021 | 42.66 | 95.49 | 2.25 |
| 2022 | 43.74 | 164.56 | 3.79 |
| 2023 | 45.10 | 188.19 | 4.17 |
Cogeneration
As of the end of December 2023, there are 48 cogeneration operators have signed the power purchase agreement with Taipower. The total installed capacity is 4,940 MW, with a peak guaranteed capacity of 1,917 MW. The distribution by fuel type is as follows:
| Fuel | Number | Capacity (MW) |
Firm capacity of peak period (MW) |
|---|---|---|---|
| Coal | 20 | 4,288 | 1,466 |
| Gasoline | 2 | 25 | 0 |
| Biogas and Waste | 26 | 627 | 451 |
| Total | 48 | 4,940 | 1,917 |
Contract Valid Period: The contract is valid for one year and can be terminated by mutual agreement at any time. If no written objections are raised before the contract expires, it will automatically extend for another year and the procedure will apply thereafter.
| Year | Power Purchased (TWh) |
Fee (billion NT$) |
Average Purchase Rate (NT$/ Per kWh) |
|---|---|---|---|
| 2019 | 6.88 | 14.31 | 2.06 |
| 2020 | 6.79 | 13.88 | 2.04 |
| 2021 | 7.84 | 18.77 | 2.39 |
| 2022 | 6.05 | 21.54 | 3.55 |
| 2023 | 8.30 | 25.51 | 3.07 |
According to the “Cogeneration System Implementation Regulations”, power purchase from cogeneration includes the electricity generated from waste and biogas.
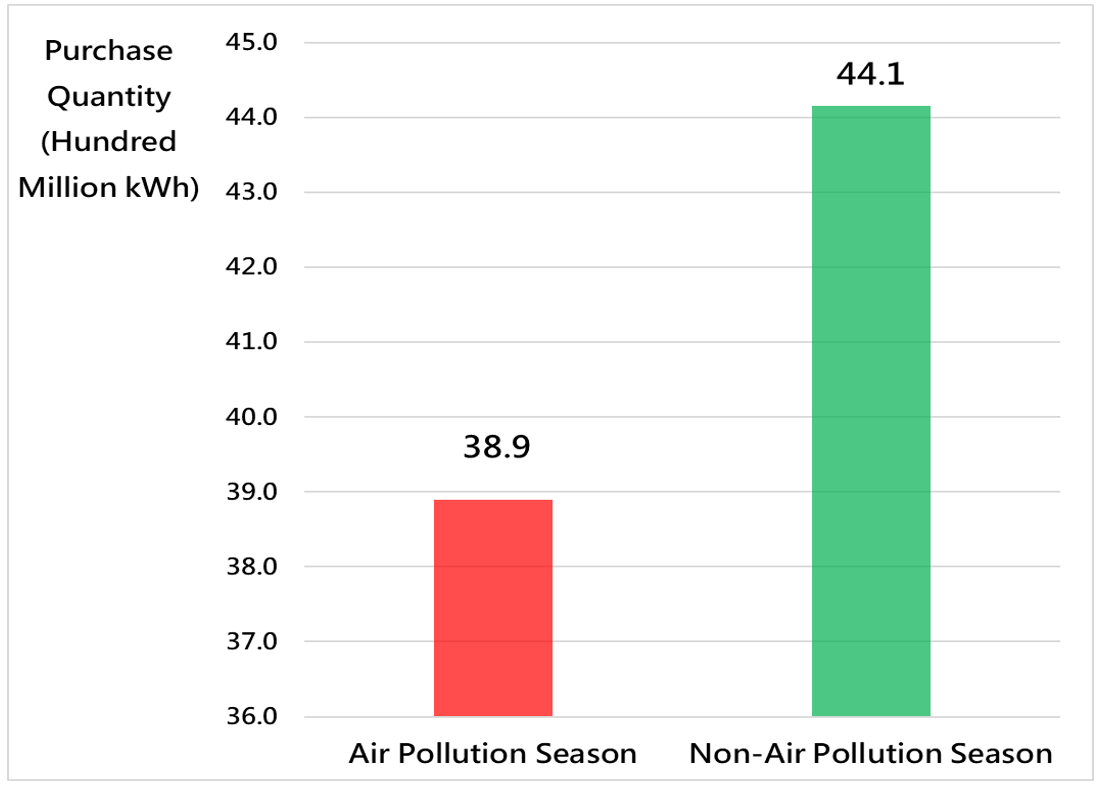
According to the power purchase agreement, routine maintenance of the cogeneration units should be scheduled in the non-summer months (outside the period from May 16 to October 15). Therefore, the off-peak season of selling electricity from contracted qualified cogeneration systems often occurs during the air pollution season (January, February, March, October, November, and December) resulting in a comparatively significant decrease in electricity sales compared to the non-air pollution season (April to September). The generation conditions are illustrated in the following chart:
The Comparison Chart of Power Generation by Contracted Qualified Cogeneration Systems Between Air Pollution Season and Non-Air Pollution Season in 2023: